Notes from Site Reliability Engineering - Betsy Beyer
10 November 2022

These are my notes from reading Site Reliability Engineering: How Google Runs Production Systems available to read online. They are loosely organized based on chapter names and themes. Overall, I found the book a really good read and I highly recommend it to anyone in the DevOps/Platform/SRE space and I am eager to dive into some of the other titles:
- Building Secure and Reliable Systems
- The Site Reliability Workbook and
- Seeking SRE
Introduction
- We (SRE) are distinct from the industry term DevOps, because although we definitely regard infrastructure as code, we have reliability as our main focus. Additionally, we are strongly oriented toward removing the necessity for operations.
- They (development/ops) have different assumptions about the target level of product stability.
- Our Site Reliability Engineering teams focus on hiring software engineers to run our products and to create systems to accomplish the work that would otherwise be performed, often manually, by sysadmins.
- What exactly is Site Reliability Engineering, as it has come to be defined at Google? My explanation is simple: SRE is what happens when you ask a software engineer to design an operations team.
- Google places a 50% cap on the aggregate “ops” work for all SREs—tickets, on-call, manual tasks, etc. This cap ensures that the SRE team has enough time in their schedule to make the service stable and operable.
- We want systems that are automatic, not just automated.
- One continual challenge Google faces is hiring SREs: not only does SRE compete for the same candidates as the product development hiring pipeline, but the fact that we set the hiring bar so high in terms of both coding and system engineering skills means that our hiring pool is necessarily small.
- In general, an SRE team is responsible for the availability, latency, performance, efficiency, change management, monitoring, emergency response, and capacity planning of their service(s).
- In practice, this is accomplished by monitoring the amount of operational work being done by SREs, and redirecting excess operational work to the product development teams: reassigning bugs and tickets to development managers, [re]integrating developers into on-call pager rotations, and so on. The redirection ends when the operational load drops back to 50% or lower. This also provides an effective feedback mechanism, guiding developers to build systems that don’t need manual intervention. This approach works well when the entire organization—SRE and development alike—understands why the safety valve mechanism exists, and supports the goal of having no overflow events because the product doesn’t generate enough operational load to require it.
Error Budget
- The structural conflict is between pace of innovation and product stability, and as described earlier, this conflict often is expressed indirectly. In SRE we bring this conflict to the fore, and then resolve it with the introduction of an error budget.
- The error budget stems from the observation that 100% is the wrong reliability target for basically everything.
- 100% is not the right reliability target because no user can tell the difference between a system being 100% available and 99.999% available.
- There are many other systems in the path between user and service (their laptop, their home WiFi, their ISP, the power grid…) and those systems collectively are far less than 99.999% available. Thus, the marginal difference between 99.999% and 100% gets lost in the noise of other unavailability, and the user receives no benefit from the enormous effort required to add that last 0.001% of availability.
- What level of availability will the users be happy with, given how they use the product?
- What happens to users’ usage of the product at different availability levels?
- A service that’s 99.99% available is 0.01% unavailable. That permitted 0.01% unavailability is the service’s error budget. We can spend the budget on anything we want, as long as we don’t overspend it.
- The use of an error budget resolves the structural conflict of incentives between development and SRE. SRE’s goal is no longer “zero outages”; rather, SREs and product developers aim to spend the error budget getting maximum feature velocity. This change makes all the difference. An outage is no longer a “bad” thing—it is an expected part of the process of innovation, and an occurrence that both development and SRE teams manage rather than fear.
Change Management
- Reliability is a function of mean time to failure (MTTF) and mean time to repair (MTTR).
- When humans are necessary, we have found that thinking through and recording the best practices ahead of time in a “playbook” produces roughly a 3x improvement in MTTR as compared to the strategy of “winging it.”
- SRE has found that roughly 70% of outages are due to changes in a live system. Best practices in this domain use automation to accomplish the following: • Implementing progressive rollouts • Quickly and accurately detecting problems • Rolling back changes safely when problems arise
Capacity Planning
- Capacity planning should take both organic growth (which stems from natural product adoption and usage by customers) and inorganic growth (which results from events like feature launches, marketing campaigns, or other business-driven changes) into account.
Efficiency and Performance
- Resource use is a function of demand (load), capacity, and software efficiency. SREs predict demand, provision capacity, and can modify the software. These three factors are a large part (though not the entirety) of a service’s efficiency.
- SREs provision to meet a capacity target at a specific response speed, and thus are keenly interested in a service’s performance.
- SREs and product developers will (and should) monitor and modify a service to improve its performance, thus adding capacity and improving efficiency.
- If a task tries to use more resources than it requested, Borg kills the task and restarts it (as a slowly crashlooping task is usually preferable to a task that hasn’t been restarted at all).
Risk
- Eliminating toil is one of SRE’s most important tasks, and is the subject of Eliminating Toil. We define toil as mundane, repetitive operational work providing no enduring value, which scales linearly with service growth.
- Extreme reliability comes at a cost: maximizing stability limits how fast new features can be developed and how quickly products can be delivered to users, and dramatically increases their cost, which in turn reduces the numbers of features a team can afford to offer.
- Site Reliability Engineering seeks to balance the risk of unavailability with the goals of rapid innovation and efficient service operations, so that users’ overall happiness—with features, service, and performance—is optimized.
- That is, when we set an availability target of 99.99%,we want to exceed it, but not by much: that would waste opportunities to add features to the system, clean up technical debt, or reduce its operational costs. In a sense, we view the availability target as both a minimum and a maximum. The key advantage of this framing is that it unlocks explicit, thoughtful risk taking.
Measuring Service Risk
- At Google, however, a time-based metric for availability is usually not meaningful because we are looking across globally distributed services. Our approach to fault isolation makes it very likely that we are serving at least a subset of traffic for a given service somewhere in the world at any given time (i.e., we are at least partially “up” at all times).
- Therefore, instead of using metrics around uptime, we define availability in terms of the request success rate. Aggregate availability shows how this yield-based metric is calculated over a rolling window (i.e., proportion of successful requests over a one-day window).
- Example, a system that serves 2.5M requests in a day with a daily availability target of 99.99% can serve up to 250 errors and still hit its target for that given day.
- Quantifying unplanned downtime as a request success rate also makes this availability metric more amenable for use in systems that do not typically serve end users directly. Most non-serving systems (e.g., batch, pipeline, storage, and transactional systems) have a well-defined notion of successful and unsuccessful units of work.
- Using a request success rate defined in terms of records successfully and unsuccessfully processed, we can calculate a useful availability metric despite the fact that the batch system does not run constantly.
- Most often, we set quarterly availability targets for a service and track our performance against those targets on a weekly, or even daily, basis.
- What level of service will the users expect? • Does this service tie directly to revenue (either our revenue, or our customers’ revenue)? • Is this a paid service, or is it free? • If there are competitors in the marketplace, what level of service do those competitors provide?
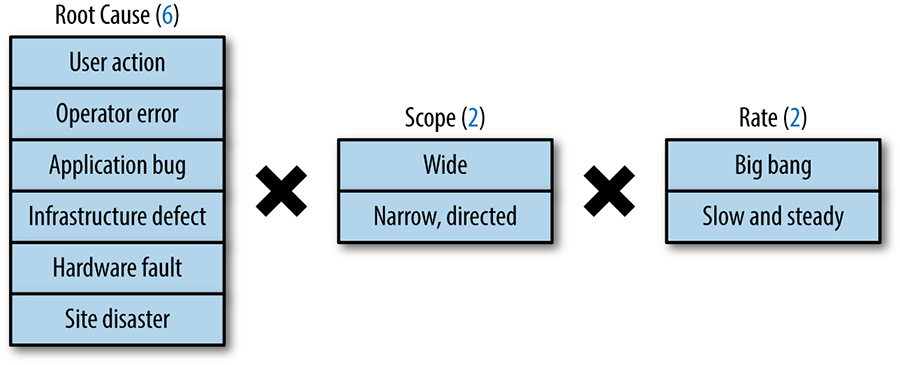
- Which is worse for the service: a constant low rate of failures, or an occasional full-site outage? Both types of failure may result in the same absolute number of errors, but may have vastly different impacts on the business.
- If we were to build and operate these systems at one more nine of availability, what would our incremental increase in revenue be?
- Does this additional revenue offset the cost of reaching that level of reliability?
- While there are significant differences between ISPs and protocols (e.g., TCP versus UDP, IPv4 versus IPv6), we’ve measured the typical background error rate for ISPs as falling between 0.01% and 1%.
Identifying the Risk Tolerance of Infrastructure Services
- One way to satisfy these competing constraints in a cost-effective manner is to partition the infrastructure and offer it at multiple independent levels of service. In the Bigtable example, we can build two types of clusters: low-latency clusters and throughput clusters.
- With explicitly delineated levels of service, the infrastructure providers can effectively externalize the difference in the cost it takes to provide service at a given level to clients. Exposing cost in this way motivates the clients to choose the level of service with the lowest cost that still meets their needs.
- We can provide vastly different service guarantees by adjusting a variety of service characteristics, such as the quantities of resources, the degree of redundancy, the geographical provisioning constraints, and, critically, the infrastructure software configuration.
Motivation for Error Budgets
- Product development performance is largely evaluated on product velocity, which creates an incentive to push new code as quickly as possible.
- Every push is risky. How much should we work on reducing that risk, versus doing other work?
- Product Management defines an SLO, which sets an expectation of how much uptime the service should have per quarter.
- As long as the uptime measured is above the SLO—in other words, as long as there is error budget remaining—new releases can be pushed.
- For example, imagine that a service’s SLO is to successfully serve 99.999% of all queries per quarter. This means that the service’s error budget is a failure rate of 0.001% for a given quarter. If a problem causes us to fail 0.0002% of the expected queries for the quarter, the problem spends 20% of the service’s quarterly error budget.
- The main benefit of an error budget is that it provides a common incentive that allows both product development and SRE to focus on finding the right balance between innovation and reliability.
- Many products use this control loop to manage release velocity: as long as the system’s SLOs are met, releases can continue. If SLO violations occur frequently enough to expend the error budget, releases are temporarily halted while additional resources are invested in system testing and development to make the system more resilient, improve its performance, and so on. More subtle and effective approaches are available than this simple on/off technique:15 for instance, slowing down releases or rolling them back when the SLO-violation error budget is close to being used up.
- For example, if product development wants to skimp on testing or increase push velocity and SRE is resistant, the error budget guides the decision. When the budget is large, the product developers can take more risks. When the budget is nearly drained, the product developers themselves will push for more testing or slower push velocity, as they don’t want to risk.
- In effect, the product development team becomes self-policing. They know the budget and can manage their own risk. (Of course, this outcome relies on an SRE team having the authority to actually stop launches if the SLO is broken.)
- The budget also helps to highlight some of the costs of overly high reliability targets, in terms of both inflexibility and slow innovation. If the team is having trouble launching new features, they may elect to loosen the SLO (thus increasing the error budget) in order to increase innovation.
- Managing service reliability is largely about managing risk, and managing risk can be costly.
- An error budget aligns incentives and emphasizes joint ownership between SRE and product development. Error budgets make it easier to decide the rate of releases and to effectively defuse discussions about outages with stakeholders, and allows multiple teams to reach the same conclusion about production risk without rancor.
SLI, SLO, SLA
- An SLI is a service level indicator—a carefully defined quantitative measure of some aspect of the level of service that is provided.
- Request Latency, Error rate, Saturation, system Throughput (LEST).
- Another kind of SLI important to SREs is availability, or the fraction of the time that a service is usable. It is often defined in terms of the fraction of well-formed requests that succeed, sometimes called yield.
- An SLO is a service level objective: a target value or range of values for a service level that is measured by an SLI.
- Choosing and publishing SLOs to users sets expectations about how a service will perform.
- Without an explicit SLO, users often develop their own beliefs about desired performance, which may be unrelated to the beliefs held by the people designing and operating the service.
- The solution to this Chubby scenario is interesting: SRE makes sure that global Chubby meets, but does not significantly exceed, its service level objective. In any given quarter, if a true failure has not dropped availability below the target, a controlled outage will be synthesized by intentionally taking down the system. In this way, we are able to flush out unreasonable dependencies on Chubby shortly after they are added. Doing so forces service owners to reckon with the reality of distributed systems sooner rather than later.
- Finally, SLAs are service level agreements: an explicit or implicit contract with your users that includes consequences of meeting (or missing) the SLOs they contain.
- An easy way to tell the difference between an SLO and an SLA is to ask “what happens if the SLOs aren’t met?”:
- SRE doesn’t typically get involved in constructing SLAs, because SLAs are closely tied to business and product decisions. SRE does, however, get involved in helping to avoid triggering the consequences of missed SLOs. They can also help to define the SLIs: there obviously needs to be an objective way to measure the SLOs in the agreement, or disagreements will arise.
- You shouldn’t use every metric you can track in your monitoring system as an SLI; an understanding of what your users want from the system will inform the judicious selection of a few indicators.
Indicators in Practice
- User-facing serving systems, such as the Shakespeare search frontends, generally care about availability, latency, and throughput. In other words: Could we respond to the request? How long did it take to respond?
- Storage systems often emphasize latency, availability, and durability. In other words: How long does it take to read or write data? Can we access the data on demand? Is the data still there when we need it?
- Most metrics are better thought of as distributions rather than averages.
- User studies have shown that people typically prefer a slightly slower system to one with high variance in response time, so some SRE teams focus only on high percentile values, on the grounds that if the 99.9th percentile behavior is good, then the typical experience is certainly going to be.
- We recommend that you standardize on common definitions for SLIs so that you don’t have to reason about them from first principles each time.
- To save effort, build a set of reusable SLI templates for each common metric; these also make it simpler for everyone to understand what a specific SLI means.
- Start by thinking about (or finding out!) what your users care about, not what you can measure. Often, what your users care about is difficult or impossible to measure, so you’ll end up approximating users’ needs in some way. However, if you simply start with what’s easy to measure, you’ll end up with less useful SLOs.
- Don’t pick a target based on current performance
- Have as few SLOs as possible Choose just enough SLOs to provide good coverage of your system’s attributes. Defend the SLOs you pick: if you can’t ever win a conversation about priorities by quoting a particular SLO, it’s probably not worth having that SLO.
- SLOs can—and should—be a major driver in prioritizing work for SREs and product developers, because they reflect what users care about. A good SLO is a helpful, legitimate forcing function for a development team.
- Keep a safety margin Using a tighter internal SLO than the SLO advertised to users gives you room to respond to chronic problems before they become visible externally. An SLO buffer also makes it possible to accommodate re-implementations that trade performance for other attributes, such as cost or ease of maintenance, without having to disappoint users.
- Understanding how well a system is meeting its expectations helps decide whether to invest in making the system faster, more available, and more resilient. Alternatively, if the service is doing fine, perhaps staff time should be spent on other priorities, such as paying off technical debt, adding new features, or introducing other products.
Eliminating Toil
- Consistent with this data, SREs report that their top source of toil is interrupts (that is, non-urgent service-related messages and emails). The next leading source is on-call (urgent) response, followed by releases and pushes.
The Four Golden Signals
- Building dashboards Dashboards should answer basic questions about your service, and normally include some form of the four golden signals (discussed in The Four Golden Signals).
- The four golden signals of monitoring are latency, traffic, errors, and saturation. If you can only measure four metrics of your user-facing system, focus on these four.
- Latency: The time it takes to service a request. It’s important to distinguish between the latency of successful requests and the latency of failed requests.
- Traffic: A measure of how much demand is being placed on your system, measured in a high-level system-specific metric. For a web service, this measurement is usually HTTP requests per second, perhaps broken out by the nature of the requests. For a key-value storage system, this measurement might be transactions and retrievals per second.
- Errors: The rate of requests that fail, either explicitly (e.g., HTTP 500s), implicitly (for example, an HTTP 200 success response, but coupled with the wrong content), or by policy (for example, “If you committed to one-second response times, any request over one second is an error”).
- Saturation How “full” your service is. A measure of your system fraction, emphasizing the resources that are most constrained (e.g., in a memory-constrained system, show memory; in an I/O-constrained system, show I/O). Note that many systems degrade in performance before they achieve 100% utilization, so having a utilization target is essential.
- Latency increases are often a leading indicator of saturation. Measuring your 99th percentile response time over some small window (e.g., one minute) can give a very early signal of saturation. Finally, saturation is also concerned with predictions of impending saturation, such as “It looks like your database will fill its hard drive in 4 hours.”
Creating Alerts and Pages
- Does this rule detect an otherwise undetected condition that is urgent, actionable, and actively or imminently user-visible?
- Will I ever be able to ignore this alert, knowing it’s benign? When and why will I be able to ignore this alert, and how can I avoid this scenario?
- Does this alert definitely indicate that users are being negatively affected? Are there detectable cases in which users aren’t being negatively?
- Can I take action in response to this alert? Is that action urgent, or could it wait until morning? Could the action be safely automated? Will that action be a long-term fix, or just a short-term workaround?
- Every time the pager goes off, I should be able to react with a sense of urgency. I can only react with a sense of urgency a few times a day before I become fatigued.
- Every page should be actionable. • Every page response should require intelligence. If a page merely merits a robotic response, it shouldn’t be a page.
- It’s important that decisions about monitoring be made with long-term goals in mind. Every page that happens today distracts a human from improving the system for tomorrow, so there is often a case for taking a short-term hit to availability or performance in order to improve the long-term outlook for the system.
- It’s important not to think of every page as an event in isolation, but to consider whether the overall level of paging leads toward a healthy, appropriately available system with a healthy, viable team and long-term outlook. We review statistics about page frequency (usually expressed as incidents per shift, where an incident might be composed of a few related pages) in quarterly reports with management, ensuring that decision makers are kept up to date on the pager load and overall health of their teams.
Automation
- We graduated from optimizing our infrastructure for a lack of failover to embracing the idea that failure is inevitable, and therefore optimizing to recover quickly through automation.
- Automation processes can vary in three respects: • Competence, i.e., their accuracy • Latency, how quickly all steps are executed when initiated • Relevance, or proportion of real-world process
- Reliability is the fundamental feature, and autonomous, resilient behavior is one useful way to get that.
Release Engineering
- Changes to any aspect of the release process should be intentional, rather than accidental.
- Making sure that our tools behave correctly by default and are adequately documented makes it easy for teams to stay focused on features and users, rather than spending time reinventing the wheel (poorly) when it comes to releasing software.
Self-Service Model
- In order to work at scale, teams must be self-sufficient.
- Some teams perform hourly builds and then select the version to actually deploy to production from the resulting pool of builds. Selection is based upon the test results and the features contained in a given build.
- Other teams have adopted a “Push on Green” release model and deploy every build that passes all tests.
- Hermetic Builds: The build process is self-contained and must not rely on services that are external to the build environment.
Branching
- All code is checked into the main branch of the source code tree (mainline). However, most major projects don’t release directly from the mainline. Instead, we branch from the mainline
- At a specific revision and never merge changes from the branch back into the mainline. Bug fixes are submitted to the mainline and then cherry picked into the branch for inclusion in the release. This practice avoids inadvertently picking up unrelated changes submitted to the mainline since the original build occurred. Using this branch and cherry pick method, we know the exact contents of each release.
- Release engineering recommends that the continuous build test targets correspond to the same test targets that gate the project release.
- During the release process, we re-run the unit tests using the release branch and create an audit trail showing that all the tests passed. This step is important because if a release involves cherry picks, the release branch may contain a version of the code that doesn’t exist anywhere on the mainline. We want to guarantee that the tests pass in the context of what’s actually being released.
Simplicity
- SREs work to create procedures, practices, and tools that render software more reliable.
- At the same time, SREs ensure that this work has as little impact on developer agility as possible.
- Push back when accidental complexity is introduced into the systems for which they are responsible
- Constantly strive to eliminate complexity in systems they onboard and for which they assume operational responsibility
- SRE promotes practices that make it more likely that all code has an essential purpose, such as scrutinizing code to make sure that it actually drives business goals, routinely removing dead code, and building bloat detection into all levels of testing.
Practices
- Put simply, SREs run services—a set of related systems, operated for users, who may be internal or external—and are ultimately responsible for the health of these services. Successfully operating a service entails a wide range of activities: developing monitoring systems, planning capacity, responding to incidents, ensuring the root causes of outages are
- Without monitoring, you have no way to tell whether the service is even working; absent a thoughtfully designed monitoring infrastructure, you’re flying blind. Maybe everyone who tries to use the website gets an error, maybe not—but you want to be aware of problems before your users notice them.
- During an incident, it’s often tempting to give in to adrenalin and start responding ad hoc. We advise against this temptation in Emergency Response, and counsel in Managing Incidents, that managing incidents effectively should reduce their impact and limit outage-induced anxiety.
- An ounce of prevention is worth a pound of cure.
Blackbox Monitoring
- However, white-box monitoring does not provide a full picture of the system being monitored; relying solely upon white-box monitoring means that you aren’t aware of what the users see. You only see the queries that arrive at the target; the queries that never make it due to a DNS error are invisible, while queries lost due to a server crash never make a sound. You can only alert on the failures that you expected.
Being On-Call
- We strongly believe that the “E” in “SRE” is a defining characteristic of our organization, so we strive to invest at least 50% of SRE time into engineering: of the remainder, no more than 25% can be spent on-call, leaving up to another 25% on other types of operational, non-project work.
- It’s important that on-call SREs understand that they can rely on several resources that make the experience of being on-call less daunting than it may seem. The most important on-call resources are: • Clear escalation paths • Well-defined incident-management procedures • A blameless postmortem culture.
- This web-based tool allows incident managers to focus on dealing with the incident, rather than spending time and cognitive effort on mundane actions such as formatting emails or updating several communication channels at once.
- Finally, when an incident occurs, it’s important to evaluate what went wrong, recognize what went well, and take action to prevent the same errors from recurring in the future.
- Recognizing automation opportunities is one of the best ways to prevent human errors.
Operational Overload
- Misconfigured monitoring is a common cause of operational overload. Paging alerts should be aligned with the symptoms that threaten a service’s SLOs. All paging alerts should also be actionable. Low-priority alerts that bother the on-call engineer every hour (or more frequently) disrupt productivity, and the fatigue such alerts induce can also cause serious alerts to be treated with less attention than necessary.
- Noisy alerts that systematically generate more than one alert per incident should be tweaked to approach a 1:1 alert/incident ratio. Doing so allows the on-call engineer to focus on the incident instead of triaging duplicate alerts
Operational Underload
- “Wheel of Misfortune” exercises (discussed in Accelerating SREs to On-Call and Beyond) are also useful team activities that can help to hone and improve troubleshooting skills and knowledge of the service.
- Google also has a company-wide annual disaster recovery event called DiRT (Disaster Recovery Training) that combines theoretical and practical drills to perform multiday testing of infrastructure systems and individual services.
Effective Troubleshooting
- Be warned that being an expert is more than understanding how a system is supposed to work. Expertise is gained by investigating why a system doesn’t work.
- Ways in which things go right are special cases of the ways in which things go wrong.
- Instead, your course of action should be to make the system work as well as it can under the circumstances.
- Novice pilots are taught that their first responsibility in an emergency is to fly the airplane; troubleshooting is secondary to getting the plane and everyone on it safely onto the ground.
- It’s really useful to have multiple verbosity levels available, along with a way to increase these levels on the fly. This functionality enables you to examine any or all operations in incredible detail without having to restart your process, while still allowing you to dial back the verbosity levels when your service is operating normally.
Managing Incidents
- Incident Command: The incident commander holds the high-level state about the incident. They structure the incident response task force, assigning responsibilities according to need and priority. De facto, the commander holds all positions that they have not delegated. If appropriate, they can remove roadblocks that prevent Ops from working most effectively.
- Operational Work: The Ops lead works with the incident commander to respond to the incident by applying operational tools to the task at hand. The operations team should be the only group modifying the system during an incident.
- Communication: This person is the public face of the incident response task force. Their duties most definitely include issuing periodic updates to the incident response team and stakeholders (usually via email), and may extend to tasks such as keeping the incident document accurate and up to date.
Testing for Reliability
- One key responsibility of Site Reliability Engineers is to quantify confidence in the systems they maintain.
- Confidence can be measured both by past reliability and future reliability.
- The Mean Time to Repair (MTTR) measures how long it takes the operations team to fix the bug, either through a rollback or another action.
- It’s possible for a testing system to identify a bug with zero MTTR. Zero MTTR occurs when a system-level test is applied to a subsystem, and that test detects the exact same problem that monitoring would detect. Such a test enables the push to be blocked so the bug never reaches production (though it still needs to be repaired in the source code).
- The more bugs you can find with zero MTTR, the higher the Mean Time Between Failures (MTBF) experienced by your users.
Software Engineering in SRE
- As with any product, SRE-developed software must be designed with knowledge of its users and requirements. It needs to drive adoption through utility, performance, and demonstrated ability to both benefit Google’s production reliability goals and to better the lives of SREs.
- The process of socializing a product and achieving buy-in across an organization is key to the project’s success.
- Don’t underestimate the effort required to raise awareness and interest in your software product—a single presentation or email announcement isn’t enough.
Handling Overload
- At the end of the day, it’s best to build clients and backends to handle resource restrictions gracefully: redirect when possible, serve degraded results when necessary, and handle resource errors transparently when all else fails.
- Different queries can have vastly different resource requirements.
- We often speak about the cost of a request to refer to a normalized measure of how much CPU time it has consumed (over different CPU architectures, with consideration of performance differences).
- Serve degraded results Serve lower-quality, cheaper-to-compute results to the user. Your strategy here will be service-specific. See Load Shedding and Graceful Degradation.
- Instrument the server to reject requests when overloaded Servers should protect themselves from becoming overloaded and crashing.When overloaded at either the frontend or backend layers, fail early and cheaply. For details, see Load Shedding and Graceful Degradation.
- Remember that the code path you never use is the code path that (often) doesn’t work.
- As load increases, there is usually a window in which CPU usage and load on the service correspond linearly, and response times stay mostly constant. At some point, many services reach a point of nonlinearity as they approach overload.
Client-Side Throttling
- We implemented client-side throttling through a technique we call adaptive throttling. Specifically, each client task keeps the following information for the last two minutes of its history:
- Requests: The number of requests attempted by the application layer(at the client, on top of the adaptive throttling system)
- Accepts: The number of requests accepted by the backend Under normal conditions, the two values are equal. As the backend starts rejecting traffic, the number of accepts becomes smaller than the number of requests. Clients can continue to issue requests to the backend until requests is K times as large as accepts. Once that cutoff is reached, the client begins to self-regulate and new requests are rejected locally (i.e., at the client) with the probability calculated in Client request rejection probability.
- Criticality is another notion that we’ve found very useful in the context of global quotas and throttling. A request made to a backend is associated with one of four possible criticality values, depending on how critical we consider that request.
- If at first you don’t succeed, back off exponentially.
Data Integrity
- If you take away just one lesson from this chapter, remember that you only know that you can recover your recent state if you actually do so.
- Recognizing that not just anything can go wrong, but that everything will go wrong is a significant step toward preparation for any real emergency.
- A matrix of all possible combinations of disasters with plans to address each of these disasters permits you to sleep soundly for at least one night; keeping your recovery plans current and exercised permits you to sleep the other 364 nights of the year.
- As you get better at recovering from any breakage in reasonable time N, find ways to whittle down that time through more rapid and finer-grained loss detection, with the goal of approaching N = 0. You can then switch from planning recovery to planning prevention, with the aim of achieving the holy grail of all the data, all the time. Achieve this goal, and you can sleep on the beach on that well-deserved vacation.
Reliable Product Launches at Scale
- Anticipating the many different ways this launch could go wrong and coordinating between the different engineering groups involved in the launch fell to a special team within Site Reliability Engineering: the Launch Coordination Engineers (LCE).
- This consulting team, Launch Coordination Engineering (LCE), facilitates a smooth launch process in a few ways: • Auditing products and services for compliance with Google’s reliability standards and best practices, and providing specific actions to improve reliability • Acting as a liaison between the multiple teams involved in a launch • Driving the technical aspects of a launch by making sure that tasks maintain momentum • Acting as gatekeepers and signing off on launches determined to be “safe” • Educating developers on best practices and on how to integrate with Google’s services, equipping them with internal documentation
- Our Launch Coordination Engineering team is composed of Launch Coordination Engineers (LCEs), who are either hired directly into this role, or are SREs with hands-on experience running Google services. LCEs are held to the same technical requirements as any other SRE, and are also expected to have strong communication and leadership skills—an LCE brings disparate parties together to work toward a common goal, mediates occasional conflicts, and guides, coaches, and educates fellow engineers.
- The checklist (Launch Coordination Checklist) helps an LCE assess the launch and provides the launching team with action items and pointers to more information. Here are some examples of items a checklist might include:
- Question: Do you need a new domain name?–Action item: Coordinate with marketing on your desired domain name, and request registration of the domain. Here is a link to the marketing form. • Question: Are you storing persistent data?–Action item: Make sure you implement backups. Here are instructions for implementing backups. • Question: Could a user potentially abuse your service?–Action item: Implement rate limiting and quotas. Use the following shared service.
- Is this launch tied to a press release, advertisement, blog post, or other form of promotion? • How much traffic and rate of growth do you expect during and after the launch? • Have you obtained all the compute resources needed to support your traffic?
Dealing with Interrupts
- Pages concern production alerts and their fallout, and are triggered in response to production emergencies. They can sometimes be monotonous and recurring, requiring little thought. They can also be engaging and involve tactical in-depth thought. Pages always have an expected response time (SLO), which is sometimes measured in minutes.
- Tickets concern customer requests that require you to take an action.
- Ongoing operational responsibilities (also known as “Kicking the can down the road” and “toil”; see Eliminating Toil) include activities like team-owned code or flag rollouts, or responses to ad hoc, time-sensitive questions from customers.
- Polarizing time means that when a person comes into work each day, they should know if they’re doing just project work or just interrupts.
- The primary on-call engineer should focus solely on on-call work. If the pager is quiet for your service, tickets or other interrupt-based work that can be abandoned fairly quickly should be part of on-call duties. When an engineer is on-call for a week, that week should be written off as far as project work is concerned. If a project is too important to let slip by a week, that person shouldn’t be on-call. Escalate in order to assign someone else to the on-call shift. A person should never be expected to be on-call and also make progress on projects (or anything else with a high context switching cost).
- A caveat to the preceding solutions is that you need to find a balance between respect for the customer and for yourself. Your guiding principle in constructing a strategy for dealing with customer requests is that the request should be meaningful, be rational, and provide all the information and legwork you need in order to fulfill the request. In return, your response should be helpful and timely.
Embedding an SRE to recover from Operational Overload
- Your job while embedded with the team is to articulate why processes and habits contribute to, or detract from, the service’s scalability.
- Your first goal for the team should be writing a service level objective (SLO), if one doesn’t already exist. The SLO is important because it provides a quantitative measure of the impact of outages, in addition to how important a process change could be. An SLO is probably the single most important lever for moving a team from reactive ops work to a healthy, long-term SRE focus. If this agreement is missing, no other advice in this chapter will be helpful. If you find yourself on a team without SLOs, first read Service Level Objectives, then get the tech leads and management in a room and start arbitrating.
- “I’m not pushing back on the latest release because the tests are bad. I’m pushing back because the error budget we set for releases is exhausted.” • “Releases need to be rollback-safe because our SLO is tight. Meeting that SLO requires that the mean time to recovery is small, so in-depth diagnosis before a rollback is not realistic.”
Production Meetings
- Production meetings are a special kind of meeting where an SRE team carefully articulates to itself—and to its invitees—the state of the service(s) in their charge, so as to increase general awareness among everyone who cares, and to improve the operation of the service(s). In general, these meetings are service-oriented; they are not directly about the status updates of individuals.
- The goal is for everyone to leave the meeting with an idea of what’s going on—the same idea. The other major goal of production meetings is to improve our services by bringing the wisdom of production to bear on our services. That means we talk in detail about the operational performance of the service, and relate that operational performance to design, configuration, or implementation, and make recommendations for how to fix the problems. Connecting the performance of the service with design decisions in a regular meeting is an immensely powerful feedback loop.
- weekly; given SRE’s antipathy to pointless meetings, this frequency seems to be just about right: time to allow enough relevant material to accumulate to make the meeting worthwhile, while not so frequent that people find excuses to not attend. They usually last somewhere between 30 and 60 minutes. Any less and you’re probably cutting something unnecessarily short, or you should probably be growing your service portfolio. Any more and you’re probably getting mired in the detail, or you’ve got too much to talk about and you should shard the team or service set.
- Just like any other meeting, the production meeting should have a chair. Many SRE teams rotate the chair through various team members, which has the advantage of making everyone feel they have a stake in the service and some notional ownership of the issues. It’s true that not everyone has equal levels of chairing skill, but the value of group ownership is so large that the trade-off of temporary suboptimality is worthwhile. Furthermore, this is a chance to instill chairing skills, which are very useful in the kind of incident coordination situations commonly faced by SRE.
- Upcoming production changes
- Metrics: One of the major ways we conduct a service-oriented discussion is by talking about the core metrics of the systems in question; see Service Level Objectives. Even if the systems didn’t dramatically fail that week, it’s very common to be in a position where you’re looking at gradually (or sharply!) increasing load throughout the year. Keeping track of how your latency figures, CPU utilization figures, etc., change over time is incredibly valuable for developing a feeling for the performance envelope of a system.
- Outages
- Paging events: There are two implicit questions for this section: should that alert have paged in the way it did, and should it have paged at all? If the answer to the last question is no, remove those unactionable pages. An issue that probably should have paged, but didn’t. An issue that is not pageable but requires attention,
- An issue that is not pageable and does not require attention.
- Prior action items
Collaboration within SRE
- We try to have a crisp team charter to define what a team will—and more importantly, won’t—support, but we don’t always succeed.
Production Readiness Review (PRR)
- A PRR is considered a prerequisite for an SRE team to accept responsibility for managing the production aspects of a service.
- Google’s Production Guide documents production best practices for services, as determined by the experiences of SRE and development teams alike. Developers can implement the solutions and recommendations in such documentation to improve their services.
Frameworks
- SRE builds framework modules to implement canonical solutions for the concerned production area. As a result, development teams can focus on the business logic, because the framework already takes care of correct infrastructure use.
- A framework essentially is a prescriptive implementation for using a set of software components and a canonical way of combining these components. The framework can also expose features that control various components in a cohesive manner.
- Business logic organized as well-defined semantic components that can be referenced using standard terms • Standard dimensions for monitoring instrumentation • A standard format for request debugging logs • A standard configuration format for managing load shedding • Capacity of a single server and determination of “overload” that can both use a semantically consistent measure for feedback to various control systems
Conclusions
- In essence, Google has adapted known reliability principles that were in many cases developed and honed in other industries to create its own unique reliability culture, one that addresses a complicated equation that balances scale, complexity, and velocity with high reliability.
- SRE teams are constructed so that our engineers divide their time between two equally important types of work. SREs staff on-call shifts, which entail putting our hands around the systems, observing where and how these systems break, and understanding challenges such as how to best scale them. But we also have time to then reflect and decide what to build in order to make those systems easier to manage. In essence, we have the pleasure of playing both the roles of the pilot and the engineer/designer. Our experiences running massive computing infrastructure are codified in actual code and then packaged as a discrete product.
- Using an aggregate unavailability metric (i.e., “ X % of all operations failed”) is more useful than focusing on outage lengths for services that may be partially available—for instance, due to having multiple replicas, only some of which are unavailable—and for services whose load varies over the course of a day or week rather than remaining constant.
Define SLOs like a User
- Measure availability and performance in terms that matter to an end user.
- Example Measuring error rates and latency at the Gmail client, rather than at the server, resulted in a substantial reduction in our assessment of Gmail availability, and prompted changes to both Gmail client and server code.
Error Budgets
- A budget is simply 1 minus a service’s SLO; for instance, a service with a 99.99% availability target has a 0.01% “budget” for unavailability. As long as the service hasn’t spent its error budget for the month through the background rate of errors plus any downtime, the development team is free (within reason) to launch new features, updates, and so on.
- If the error budget is spent, the service freezes changes (except urgent security and bug fixes addressing any cause of the increased errors) until either the service has earned back room in the budget, or the month resets. For mature services with an SLO greater than 99.99%, a quarterly rather than monthly budget reset is appropriate, because the amount of allowable downtime is small.
Overloads and Failures
- For times when load is high enough that even degraded responses are too expensive for all queries, practice graceful load shedding, using well-behaved queuing and dynamic timeouts; see Handling Overload. Other techniques include answering requests after a significant delay (“tarpitting”) and choosing a consistent subset of clients to receive errors, preserving a good user experience for the remainder.